Midwest Rental Markets 2026: Where Yield Meets Growth
Three Midwest states did something in 2026 that most of the country did not: they went up. Ohio is up 3.5% on the year, Indiana 3.0% and Missouri 3.2%, with gross yields of 6.61%, 6.10% and 5.75% respectively.
The region's reputation is cheap houses and no growth. The decade figures say otherwise — Indiana added 98.1%, Ohio 91.0%, Missouri 84.9%. Let's look at what is actually happening.
1. The Three States, Compared
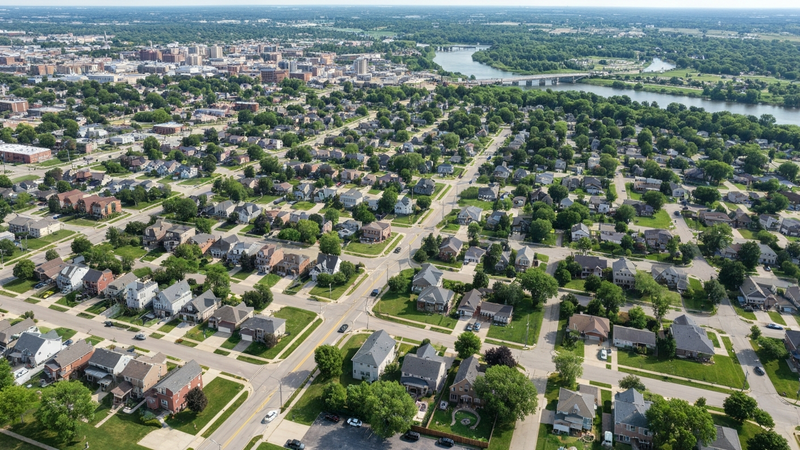
All three combine positive annual movement with yields above 5.7% — a combination that has become rare. Ohio leads on yield at 6.61%, Indiana on decade growth at 98.1%, and Missouri sits between them on both measures.
None of these are boom markets and none pretend to be. What they offer is compounding at a modest rate on top of income that arrives every month.
| State | Typical value | 1-yr | 5-yr | 10-yr | Gross yield |
|---|---|---|---|---|---|
| Ohio | $251,502 | +3.5% | +30.4% | +91.0% | 6.61% |
| Indiana | $262,265 | +3.0% | +31.3% | +98.1% | 6.10% |
| Missouri | $271,597 | +3.2% | +27.6% | +84.9% | 5.75% |
Zillow ZHVI and ZORI, mid-2026. Gross yield is annualized rent divided by typical value, before all costs.
Full state detail sits on our markets pages, which carry the ten-year series for each.
2. The Secondary Cities Are Outperforming
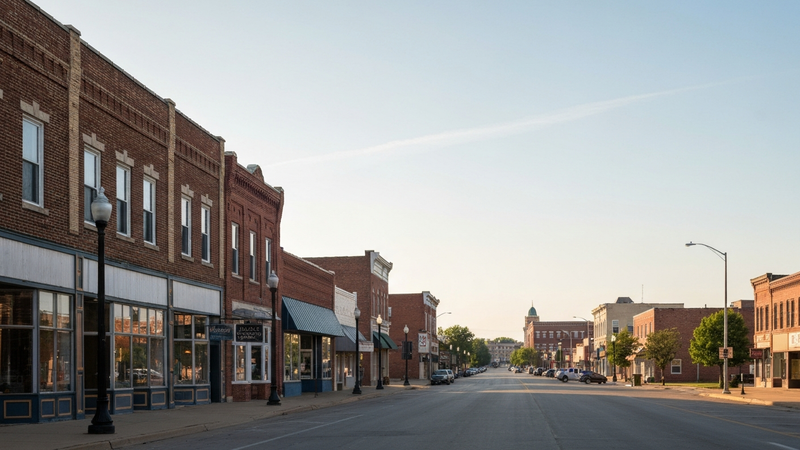
The pattern that matters is not at state level. South Bend is up 6.9% on the year and 45.2% over five, Fort Wayne 36.6% over five, Springfield Missouri 33.4%, Independence 29.8%. In each state the smaller cities have outgrown the flagship metro.
Indianapolis is down 0.5% and Saint Louis down 0.6% over the same period. The capital is rotating toward markets where the price never left reach of local incomes.
| City | State | Typical value | 5-yr | Gross yield |
|---|---|---|---|---|
| South Bend | IN | $202,069 | +45.2% | 7.78% |
| Fort Wayne | IN | $250,668 | +36.6% | 6.13% |
| Springfield | MO | $248,023 | +33.4% | 5.95% |
| Independence | MO | $214,195 | +29.8% | 7.72% |
| Saint Louis | MO | $191,644 | +13.1% | 8.73% |
Zillow ZHVI and ZORI, mid-2026. Saint Louis shows the classic high-yield, low-growth pattern; the others pair both.
South Bend and Independence are the interesting entries — yields near 7.8% alongside real five-year appreciation, a pairing that usually does not survive.
Why the smaller cities are winning
Three forces explain most of it. Affordability, because the flagship metros drifted beyond what local incomes support while the secondary cities did not. Employment concentration, since a single large employer or university anchors a small city far more than it would a large one.
And supply discipline: smaller markets simply do not attract national homebuilders at scale, so new inventory arrives slowly. That is the same mechanism that produces appreciation in constrained coastal markets, operating at a much lower price level.
Saint Louis is the exception worth naming
At $191,644 and 8.73% gross with only 13.1% five-year growth, Saint Louis is the classic deep-value pattern rather than the growth-plus-yield pattern the others show. It is the highest-income market in this group and the one least likely to appreciate.
That makes it a legitimate choice for an income-first buyer and a poor one for anyone hoping for both. Naming which of the two you are buying is the whole discipline, and it is easier to do before the purchase than to rationalise afterwards.
3. What the Yields Become After Costs
Take Indianapolis: $233,826 at $1,411 a month grosses $16,932 — the 7.24%. Deduct the parcel's actual property tax, insurance, management at 8-10%, maintenance reflecting the age of the stock, and a month of vacancy: the unlevered net commonly lands near 4.5-5.5%.
That is genuinely strong, and it is reached by subtraction. The gap between gross and net is the whole Midwest story — the housing is older, turnover is higher, and the manager's competence shows up directly in the return.
Property tax varies by county and school district in all three states. Obtain the parcel's actual bill rather than a state average, as our property tax guide explains, then run the sequence in the rental yield guide.
4. The Counterargument: Population and Ceiling

The bear case is demographic. The Midwest is not gaining population at Sun Belt rates, several of these cities peaked decades ago, and abundant buildable land caps rent growth structurally. A ceiling on appreciation is a reasonable expectation rather than a pessimistic one.
The rebuttal is that the numbers already reflect it. These states delivered 85-98% over a decade while being written off as flat, and they are doing it again this year while more fashionable markets correct. For an income buyer the question is not whether the Midwest will boom — it is whether 4.5-5.5% net, compounding steadily, is a return worth having. For most portfolios it plainly is.
Compare against the coastal and Sun Belt alternatives in our market selection guide.
Financing is easier here than anywhere
Rent-to-price ratios across these three states clear DSCR underwriting comfortably at typical 25-30% down. A buyer whose coastal purchase failed on the coverage ratio can frequently obtain financing here on an identical balance sheet, because the property is doing the qualifying rather than the borrower.
That matters more for an overseas buyer than for a domestic one. Without a US credit file the financing route is narrow, and choosing a market where the ratio clears comfortably removes the constraint entirely — as our DSCR guide sets out.
Concentrate, then consider extending
The three states are similar enough that an investor could reasonably treat them as one region, and different enough in tax and landlord law that treating them that way is a mistake. Each has its own county assessment practice, eviction timeline and registration requirement.
Build three or four properties in one market with one manager before opening a second. The operational advantage of concentration is larger than the diversification benefit at this scale, as our portfolio guide argues.
Final Thoughts: A Sensible First US Market

For an overseas buyer making a first US purchase, the Midwest has an underrated advantage: entry prices low enough that learning how American management, tax filing and tenant law work does not require committing a large share of capital to a market you have never visited.
We underwrite specific properties on net rather than gross assumptions and assess management before purchase, with brokerage services provided through licensed professionals. Talk to our team before you buy in an income market.
What we watch from here: whether South Bend, Fort Wayne and Springfield sustain the growth they have shown, how county reassessment cycles land across the three states, and whether the flagship metros — Indianapolis and Saint Louis — resume rising or continue to lag the secondary cities around them.
Reinvent NY provides business consulting, operational support, and coordination services. Legal advice and immigration filings are handled by independent licensed attorneys. Real estate services are provided through licensed professionals and applicable brokerage relationships. This article is for informational purposes only and does not constitute legal or investment advice.
More market reports: Austin Real Estate Market 2026, California Real Estate Market 2026, Chicago Real Estate 2026. The full set is indexed under market data for all 51 states.

Satoshi Onodera
Founder & CEO, Reinvent NY Inc.
Founded Reinvent NY in 2024. Providing relocation support from all over the world to America.
Ready to Get Started?
Our team in New York is ready to help with your visa, real estate, or relocation needs.
Schedule a ConsultationFrequently Asked Questions
Which Midwest state offers the best rental yield?
Ohio at 6.61% gross statewide, followed by Indiana at 6.10% and Missouri at 5.75%. All three are positive on the year, which most of the country is not.
Are Midwest markets still appreciating?
Yes, and more than most people assume. Indiana added 98.1% over ten years, Ohio 91.0% and Missouri 84.9%, with all three up 3.0-3.5% in the past year.
Which cities are performing best?
The secondary ones. South Bend is up 6.9% on the year and 45.2% over five, Fort Wayne 36.6% over five, and Springfield Missouri 33.4% — all ahead of their state's larger metros.
Why are Midwest prices rising while the Sun Belt falls?
These markets never had the 2020-2022 melt-up that other regions are now correcting. Prices rose steadily rather than sharply, so there is nothing to give back.
Can an overseas investor buy here?
Yes, with no citizenship requirement. Rent-to-price ratios in the Midwest clear DSCR underwriting comfortably, which is not true of coastal markets at 2026 rates.
What is the main operational risk?
Older housing stock and management quality. The gap between gross and net yield is wider here than in newer markets, and a remote owner cannot supervise the work personally.
Is the Midwest a good first US market?
For many overseas buyers yes. Entry prices are low enough that a first purchase does not concentrate a large share of capital in a market you have never visited.
Real Estate Guides & Data
More guides
- Miami vs New York: Two US Strategies Compared
- Moving Purchase Funds to the US: Timing and Source of Funds
- New Development Walk-Throughs: The Snag List That Pays
- NYC Transfer Taxes for Sellers: The Exit's First Bill
- NYC Parking and Storage: Deeded Spaces as Assets
- Prewar vs New Construction: Two Different Assets
Related Articles
NYC Eviction Process for Landlords: Steps and Timeline
How eviction works in New York City: why a lockout is illegal, the notices that start the case, the housing court steps, and the timelines to plan around.
New York, California, Texas, Florida: 2026 Compared
The four states international buyers ask about most: New York up 5.2% on the year, California at a 4.22% yield, and what Texas and Florida really cost.
Baltimore Real Estate 2026: An 11.2% Yield Beside DC
Baltimore in 2026: a $192,669 typical value, $1,799 rents and an 11.2% gross yield — the highest on the Northeast corridor, and what the price is telling you.
Ohio Real Estate 2026: Cleveland 14%, Columbus 7%
Ohio in 2026: a $251,502 state median up 3.5% on the year, with Cleveland at a 14.13% gross yield and Columbus at 6.96% — and what separates the two.