Highest Rental Yield US Cities 2026: Where 9%+ Exists
There are American cities where a rental property collects more than 10% of its purchase price in annual rent. Cleveland leads at roughly 14.1% gross on a $121,435 typical home value; Baltimore follows at 11.2%. Against Seattle's 3.12%, the gap looks like a mispricing waiting to be harvested.
It is not a mispricing. It is a price, and the market has reasons. Let's look at where the numbers are, what causes them, and what the net figure actually looks like once the market's reasons are paid for.
1. Where the Highest Yields Actually Are
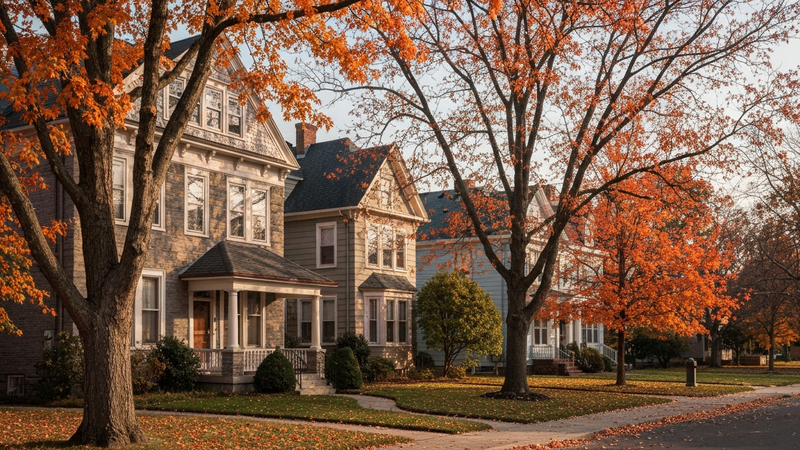
The top of the list is concentrated in the industrial Midwest and the older mid-Atlantic cities. What they share is a typical home value far below the national picture while rents sit near or above the national median — Baltimore rents $1,799 a month on a $192,669 house.
Note what is absent: nothing on the West Coast, nothing in the Northeast corridor above Baltimore, and none of the Sun Belt boom metros. High yield in 2026 lives where prices fell hardest and stayed down.
| City | Typical value | Median rent | Gross yield | 5-yr price growth |
|---|---|---|---|---|
| Cleveland, OH | $121,435 | $1,430 | 14.13% | +15.6% |
| Baltimore, MD | $192,669 | $1,799 | 11.20% | +9.4% |
| Toledo, OH | $135,476 | $1,125 | 9.97% | +32.9% |
| Philadelphia, PA | $237,459 | $1,814 | 9.17% | +7.1% |
| Saint Louis, MO | $191,644 | $1,395 | 8.73% | +13.1% |
| Pittsburgh, PA | $246,117 | $1,593 | 7.77% | +9.6% |
| Indianapolis, IN | $233,826 | $1,411 | 7.24% | +24.3% |
Zillow ZHVI and ZORI, mid-2026. Gross yield is annualized rent divided by typical value, before all costs.
The last column carries the trade. Cleveland's 14.1% yield comes with five-year price growth of 15.6% while its own state added 30.4% — the income is bought with appreciation forgone. Full state figures are on our markets pages.
2. Why the Numbers Are This High

Rent and price answer different questions. Rent is set by what local incomes can pay for available housing today. Price is set by what buyers believe about the next twenty years. Where those beliefs are pessimistic, price falls while rent holds — and yield is simply the ratio between the two.
Cleveland's population peaked in 1950. The houses were built for a city twice its current size, so supply is abundant and cheap, while the people who remain still need somewhere to live at rents their wages support. That is the entire mechanism, and it is honest rather than mysterious.
The corollary matters for underwriting: a high-yield market is a market pricing in weak future demand. If you disagree with that assessment you are making a real bet, and it should be a deliberate one rather than a byproduct of yield screening.
The two ways a high yield appears
It helps to separate them. In the first case the price fell and stayed down — Cleveland and Baltimore, where the ratio is driven by a low denominator. In the second the rent is unusually strong for the price level, which is what Toledo's 9.97% on a $135,476 base partly reflects.
The distinction matters for what you should check. A low-denominator market demands scrutiny of why the price is low and whether that reason is still operating. A high-numerator market demands scrutiny of whether the rent is durable or a temporary local squeeze that new supply will relieve.
3. From 14% Gross to What You Actually Keep

Take Cleveland's headline. A $121,435 house collecting $1,430 a month grosses $17,160 a year — the 14.1%. Now pay for what makes it cheap: older stock with real capital needs, higher vacancy and turnover, property tax, insurance, and management that has to be genuinely local.
A realistic stack on that property runs property tax, insurance, 10% management (higher than coastal norms because the work is harder), maintenance reserves that reflect a house built before 1960, and two months of combined vacancy and turnover cost. The unlevered net commonly lands at 6-8% rather than 14%.
Six to eight percent unlevered is still excellent — roughly double what a coastal metro nets. The point is that the number that matters is arrived at by subtraction, and the subtraction is larger here than anywhere else. Our rental yield guide sets out the full sequence, and the cap rate article covers how the same math is expressed for larger buildings.
Where remote owners lose the difference
Three line items destroy more returns in these markets than anything else. Turnover, because a vacant month on a $1,430 rent is a larger share of annual income than the same month on a coastal rent. Deferred capital work, because older houses do not forgive it. And management quality, because the margin per unit is too thin to attract careless operators profitably.
The remedy is unglamorous: engage the manager before choosing the property, ask for their actual turnover and delinquency figures on comparable units, and treat their answer as part of the underwriting. In a $120,000-house market, the manager is closer to being the investment than the house is.
4. The Counterargument: Are These Markets Worth Owning?
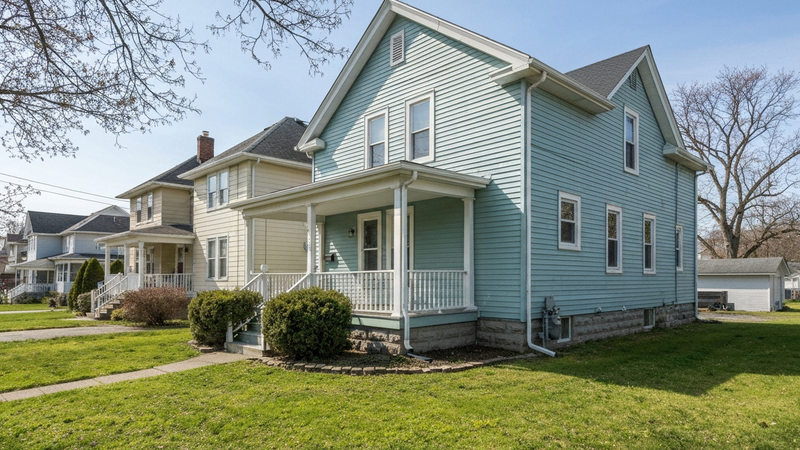
The case against is substantive. Weak or negative population growth, older housing with structural capital needs, thin resale liquidity when you want out, and the operational reality that a remote owner in a $120,000-house market lives or dies by a property manager they have never met. Some advisers refuse these markets entirely, and their reasoning is sound.
The rebuttal is that income and appreciation are two different products and most investors need the first. A portfolio built on 6-8% net unlevered cash flow compounds without requiring a market to rise, which is exactly what an owner drawing income needs. The risk is not that these markets fail — it is that they do precisely what the price predicts, and an investor who bought them expecting Sun Belt appreciation feels cheated by a return that was fully disclosed.
The practical filter: buy the high-yield market if you want cash flow, have a manager you trust on the ground, and underwrite the expense stack honestly. Buy Phoenix or Atlanta if you want a balance of both, as our metro comparison lays out.
Final Thoughts: Screen for Net, Not Gross

Gross yield is a screening tool and nothing more. Its value is in telling you where to look; its danger is in feeling like a conclusion. The cities above genuinely offer the country's strongest income, and each one asks for something in return — capital needs, thin liquidity, or a bet against the price's own forecast.
We underwrite specific properties on net rather than gross assumptions, and coordinate management and financing for overseas owners, with brokerage services provided through licensed professionals. If a high-yield market is on your list, talk to our team and we will build the expense stack before you buy.
Reinvent NY provides business consulting, operational support, and coordination services. Legal advice and immigration filings are handled by independent licensed attorneys. Real estate services are provided through licensed professionals and applicable brokerage relationships. This article is for informational purposes only and does not constitute legal or investment advice.
More market reports: Washington DC Real Estate Market 2026, Florida Real Estate for Foreigners 2026, Best States to Buy Property in the USA. The full set is indexed under market data for all 51 states.

Satoshi Onodera
Founder & CEO, Reinvent NY Inc.
Founded Reinvent NY in 2024. Providing relocation support from all over the world to America.
Ready to Get Started?
Our team in New York is ready to help with your visa, real estate, or relocation needs.
Schedule a ConsultationFrequently Asked Questions
Which US city has the highest rental yield in 2026?
Cleveland, Ohio, at roughly 14.1% gross — a $121,435 typical home value against $1,430 median asking rent. Baltimore follows at 11.2% and Toledo at 10.0%, on Zillow mid-2026 figures.
Why are yields so high in these cities?
Prices collapsed and never fully recovered while rents held. Rent is set by local incomes and housing scarcity; price reflects expectations about the future. Where the market expects little, price falls and yield rises.
Is a 14% gross yield realistic to achieve?
The gross figure is real; the net is much lower. Older housing stock, higher vacancy and turnover, insurance and property tax typically reduce a 14% gross to a 6-8% net before financing — still strong, but not 14%.
What is the difference between gross and net yield?
Gross yield is annual rent divided by price. Net yield subtracts property tax, insurance, management, maintenance, reserves and vacancy. In high-yield markets the gap between the two is unusually wide.
Should an overseas investor buy in these markets?
Only with local management in place and realistic expense assumptions. These are operationally demanding markets where the difference between a good and bad property manager is larger than the difference between cities.
Do high-yield cities appreciate?
Historically much less. Cleveland has added 15.6% over five years against Ohio's 30.4%, and the cities with the highest yields are consistently those with the weakest price growth. Yield and appreciation trade against each other.
How do these compare with coastal markets?
Seattle sits at 3.12% gross and Boston at 5.28%. The high-yield Midwest and mid-Atlantic markets offer two to four times the income on the same dollar, and correspondingly less capital growth and liquidity.
Real Estate Guides & Data
More guides
- Home Offices in NYC Apartments: Rules and Realities
- Five Ways Real Estate Investors Come Unstuck
- Buying Above $5 Million in New York: What Changes
- Mixed-Use Buildings: The Storefront Under the Stairs
- Negotiating a New York Purchase: What Moves a Seller
- Average HOA Fees in NYC and Manhattan — 2,970 Buildings
Related Articles
Is It Safe to Buy Property in New York? What Protects You
The protections behind a New York purchase: recorded title, title insurance, attorney representation, escrowed deposits, and the wire fraud risk nobody insures.
Philadelphia Real Estate Market 2026: 9.2% Gross Yield
Philadelphia in 2026: a $237,459 typical home value, $1,814 rents and a 9.17% gross yield, the strongest income of any large Northeast city, and what it costs.
Buying NYC Property From Abroad: The Practical Logistics
The mechanics overseas buyers struggle with: moving funds and proving their source, remote signing, documentation, and the sequence that avoids closing delays.
Buying in a NYC Historic District: The Landmark Rules
Inside a New York historic district the city regulates what an owner may change: what needs approval, how long it takes, and what it adds to a renovation.